Surface temperature
Surface Temperature [°C] is a low-resolution information layer generated by the Danish Meteorological Institute (DMI). It can be used for strategic planning purposes and to complement the sea ice concentration layer and optical and radar satellite images in the Arctic. The layer is updated on a daily basis and consists of satellite measurements that are interpolated to a resolution of 0.05° x 0.05°. The data allows users to analyze spatial variations in ocean and ice surface temperatures.
| Resolution: | 0.05° x 0.05° |
| Update: | daily at 14:30 UTC |
| Availability: | Arctic |
| Source: | Arctic Ocean - Sea and Ice Surface Temperature, E.U. Copernicus Marine Service Information (CMEMS). Marine Data Store (MDS). https://doi.org/10.48670/moi-00130 |
| Satellites | Meteorological Operations Satellite-A (Metop-A), VIIRS_NPP, NOAA, Sentinel-3 A/B |
| Sensor: | Advanced Very High Resolution Radiometer (AVHRR) |
| Data manual: | CMEMS-SI-PUM-011-008.pdf |
Interpretation
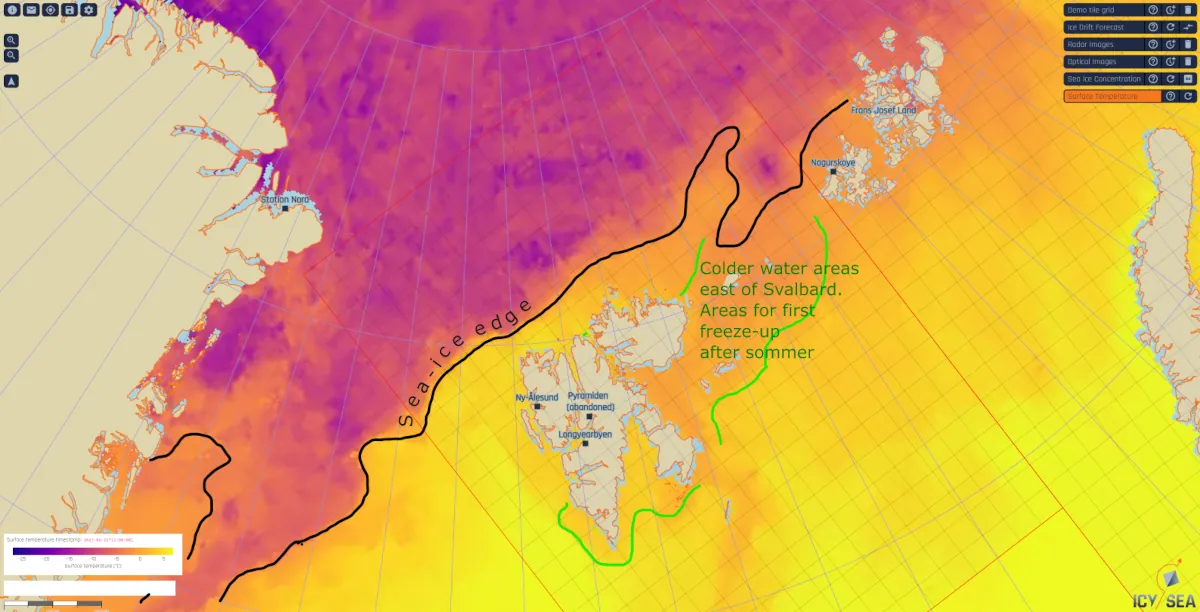
Temperatures at the ice surface are usually lower than at the ocean surface. During the winter season ice and ocean surface temperature are very distinguishable because of the strong temperature difference between the sea ice and the ocean surface. Large open water areas within the ice pack can also be identified because of that temperature difference. During the summer season when surface melt begins to alter the ice surfaces and melt ponds form, the difference between the ice and ocean surface temperature can be less distinct. With the beginning of the freezing cycle ocean surface temperatures are especially relevant for the identification of regions where ice formation is imminent. When the atmospheric temperatures decrease and the ocean surface temperature reaches the freezing point of saltwater (approximately -1.9°C) ice formation can be expected. Ocean surface temperatures below -2°C indicate either the ongoing process of ice formation or the presence of a solid ice cover.
In the open ocean spatial variations in ocean surface temperatures can indicate varying surface currents and regions where water is welling up from depth. Upwelling regions can indicate that there are higher nutrient concentrations in the area, which can be relevant for fishing activities.