Satellite radar images
The radar image layer grants you access to high resolution near-real time synthetic aperture radar (SAR) satellite images. With some experience, you can directly identify sea-ice structures such as individual ice floes or open cracks and ridges within a closed ice cover on the SAR images. For high-resolution images, one image pixel is 30x30m; for low-resolution images, one image pixel is 300mx300m.
Satellites
The images in this layer are acquired from two satellite missions:
Sentinel-1
The Sentinel-1 satellite mission, operated by the European Space Agency (ESA), is a cornerstone of the Copernicus Programme aimed at monitoring Earth's environment and providing critical data for various applications. The mission comprises one satellite (Sentinel-1A) at the moment, equipped with Synthetic Aperture Radar (SAR) technology. This radar imaging capability allows Sentinel-1 to capture high-resolution images of the Earth's surface regardless of weather conditions or daylight, ensuring consistent and reliable data acquisition. Another satellite, Sentinel-1C, is currently planned to launch in the final quarter of 2024.
RCM
The RADARSAT Constellation Mission (RCM) is a three-satellite constellation, developed and operated by CSA (Canadian Space Agency) with private sector support. It was launched in 2019 and has an expected lifespan of 7 years. RCM provides daily coverage of Canadian Waters for ship, ice and oil spill monitoring. Data is accessed via the Earth Observation Data Management System (EODMS) provided by Natural Resources Canada (NRCan).
Each of the three satellites carries a Synthetic Aperture Radar for RCM (SAR-RCM), which possesses multiple imaging modes to enable imaging of a variety of resolutions, swaths, fields of regard and polarizations. Its primary mission objectives are monitoring glacier cover, motion and topography, ice sheet and land surface topography, and sea ice cover and type. On average the SAR-RCM delivers images on a daily basis and with resolutions of approx. 20 to 40 m. Due to their 20 to 500 km swaths RCM has near global coverage in 4 days across all three satellites. Data is available approx. two hours after satellite acquisition. See eoportal.org for more details.
How old are the radar images?
The age of the radar images is critical because sea-ice conditions change continuously. On average, Arctic sea-ice drifts between 0 and >50 km a day.
Availability of satellite images depends on the image acquisition plan by the operators ESA and CSA which varies from location to location. For most Arctic regions, the combination of RCM and Sentinel-1 provides daily updates. However, coverage in the Antarctic is less comprehensive, with possible data gaps of more than four days.
For your interpretation it is crucial to take into account the age of the image. By clicking on the small clock symbol in the radar image layer button in the upper right corner of the IcySea base screen, you can see the age of every image tile in color. If you zoom in to the tile you also see the age displayed in hours. Tiles which consist of a merge from two or more satellite acquisitions display the age of each satellite image separately.
Basic Interpretation Guidelines
One needs experience and practice to interpret SAR images. Sometimes it is extremely difficult even for an expert ice analyst to identify ice features on SAR images unambiguously. Here are some fundamental guidelines which always have their exceptions:
- The SAR penetrates clouds and is independent of daylight. Whatever you see on the radar images: IT IS NEVER CLOUDS but always earth surface features (i.e. ocean, ice or land.).
- Rough surfaces appear brighter (white) than smooth surfaces (black).
- Ice features on SAR images are more distinct under winter conditions than in summer (when the ice is in the process of melting).
- Typical rough (bright, white) surfaces are: rough and windy open ocean, new ice with frost flowers, ice ridges and rubble fields, pancake ice.
- Typical smooth (dark, black) features are: calm open ocean, new thin ice, grease ice, open cracks and leads, wet and flooded ice.
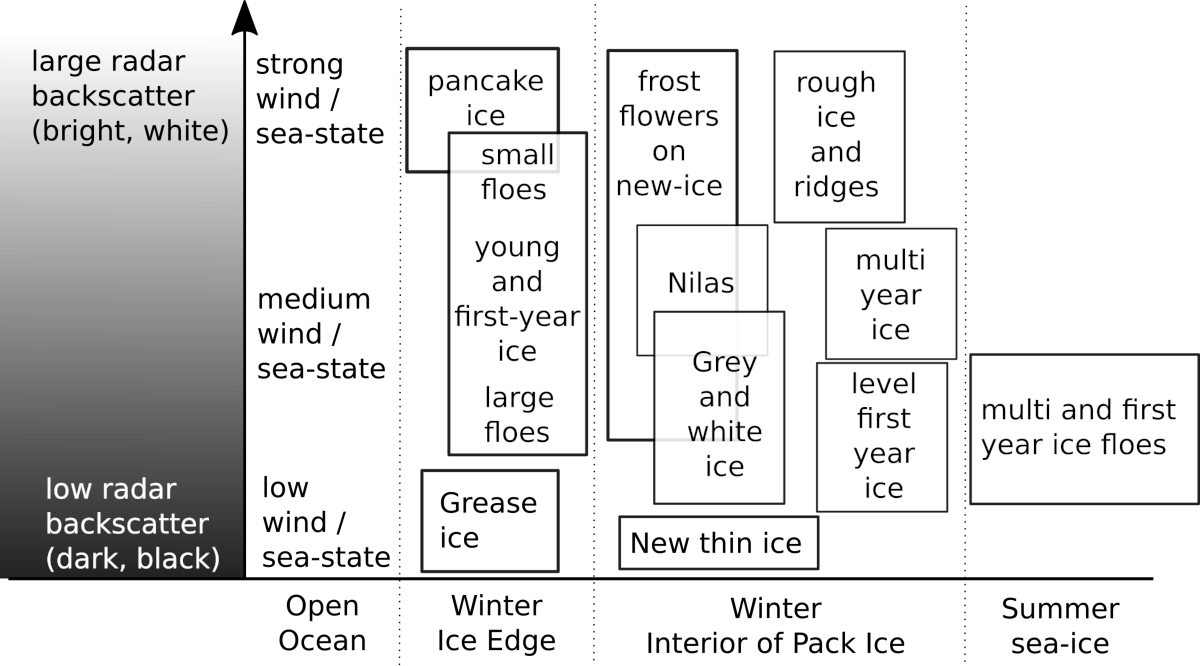
- The following graph inspired by the figure in
Johannessen et al. (1997)
summarizes qualitatively the radar backscatter strength of
typical ice features.
- Each tile has its own relative grayscale range normalized on the brightest feature in one tile. That also causes grayscale jumps at the edge to another tile.
- In ambiguous cases use additional layers such as sea-ice concentration, an ice chart or optical satellite images to support your interpretation.
- A good understanding of the appearance of sea-ice and the nature of SAR measurements is helpful.
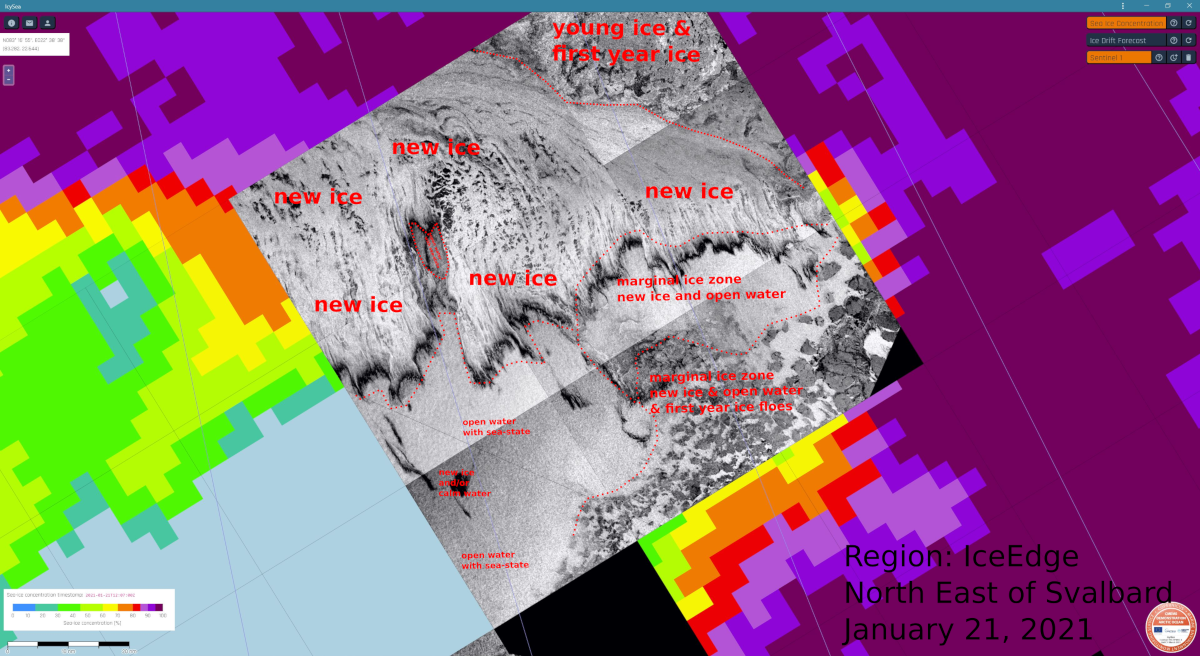
Example 1: Winter Conditions, ice edge north-east of Svalbard
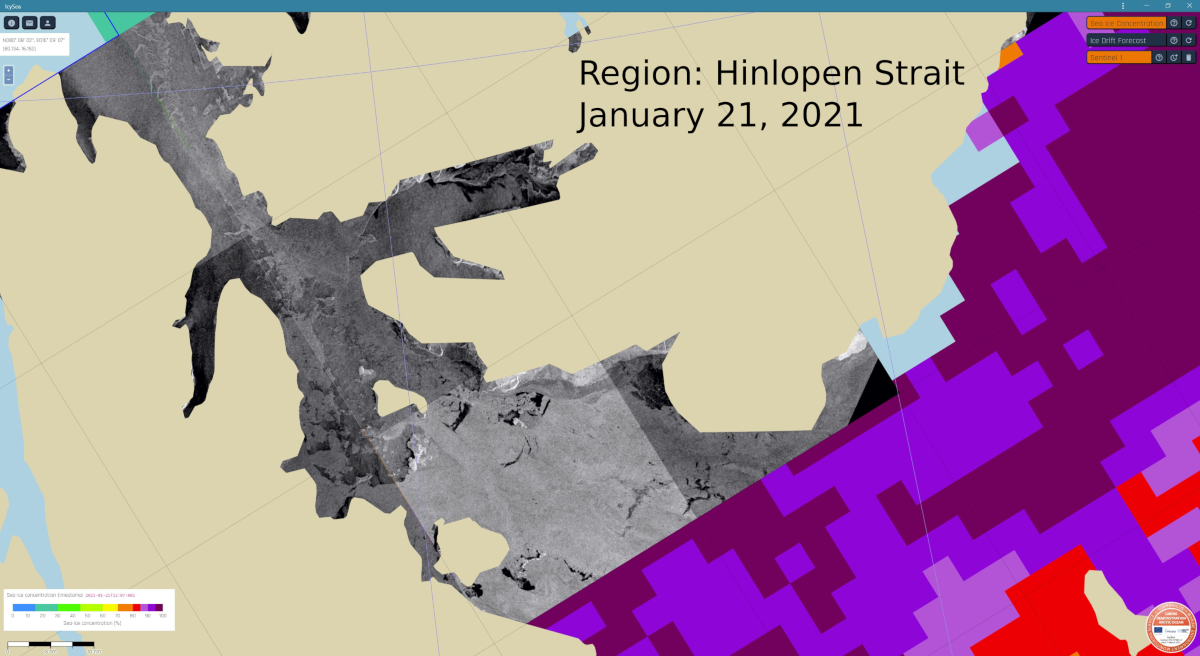
Example 2: Winter Conditions, Hinlopen Strait

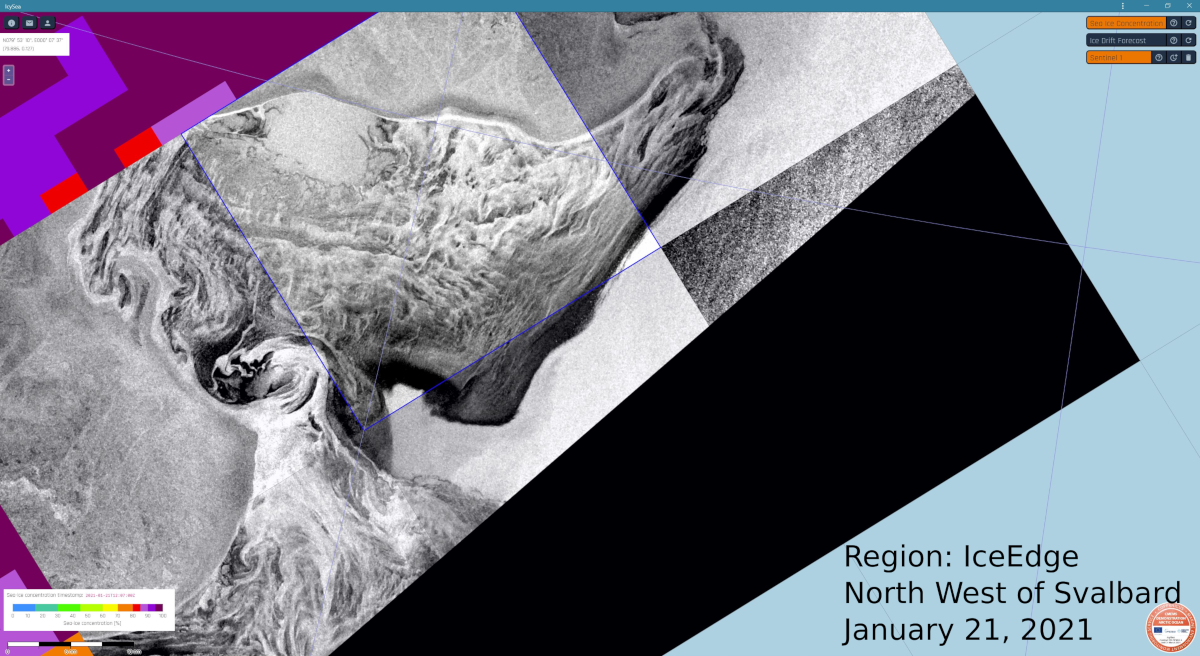
Example 3: Winter Conditions, ice edge north-west of Svalbard

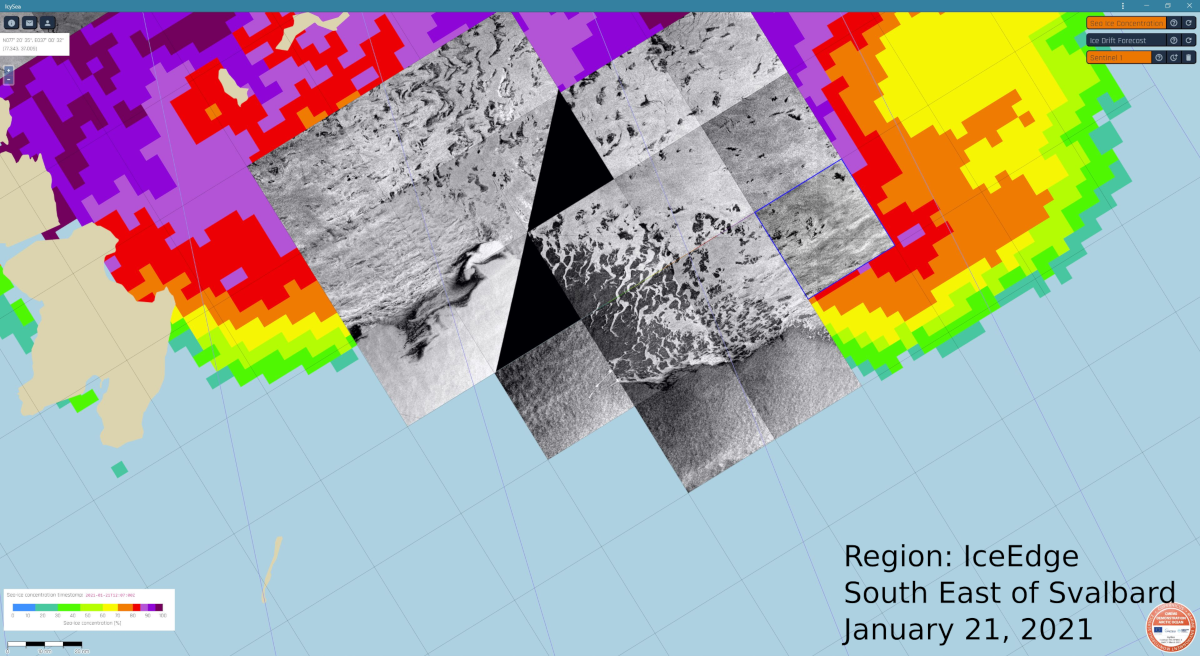
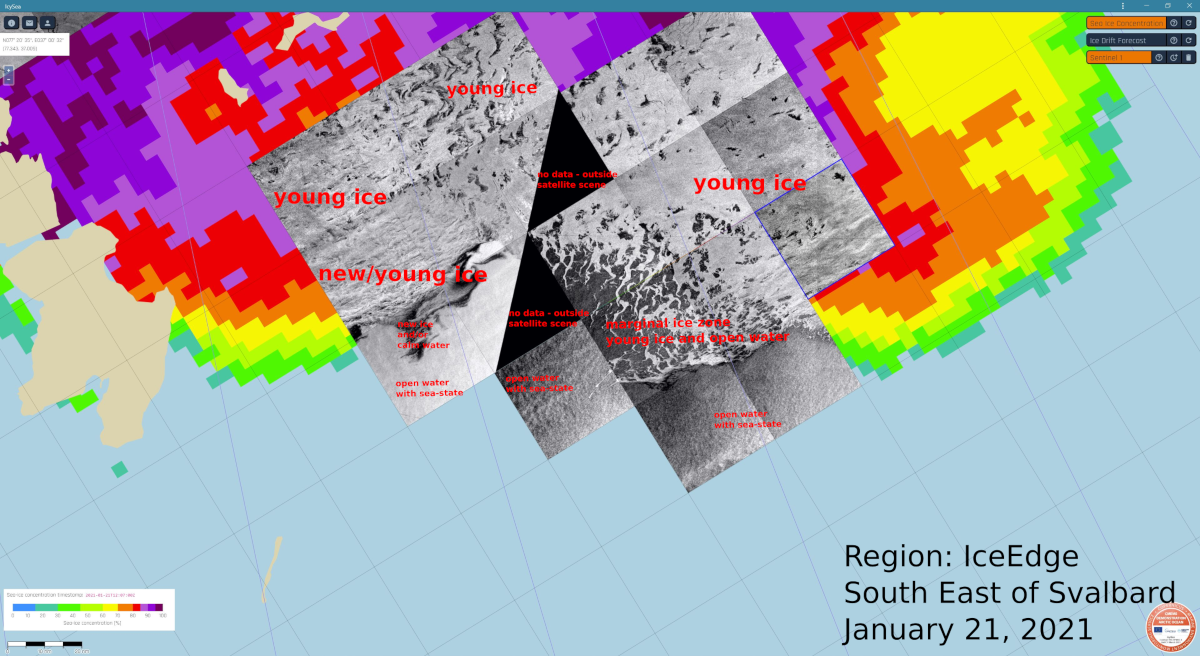
Example 4: Winter Conditions, ice edge south-east of Svalbard
Example 5: Winter Conditions, ice edge north-east of Svalbard