IcySea Sea-Ice Concentration Information
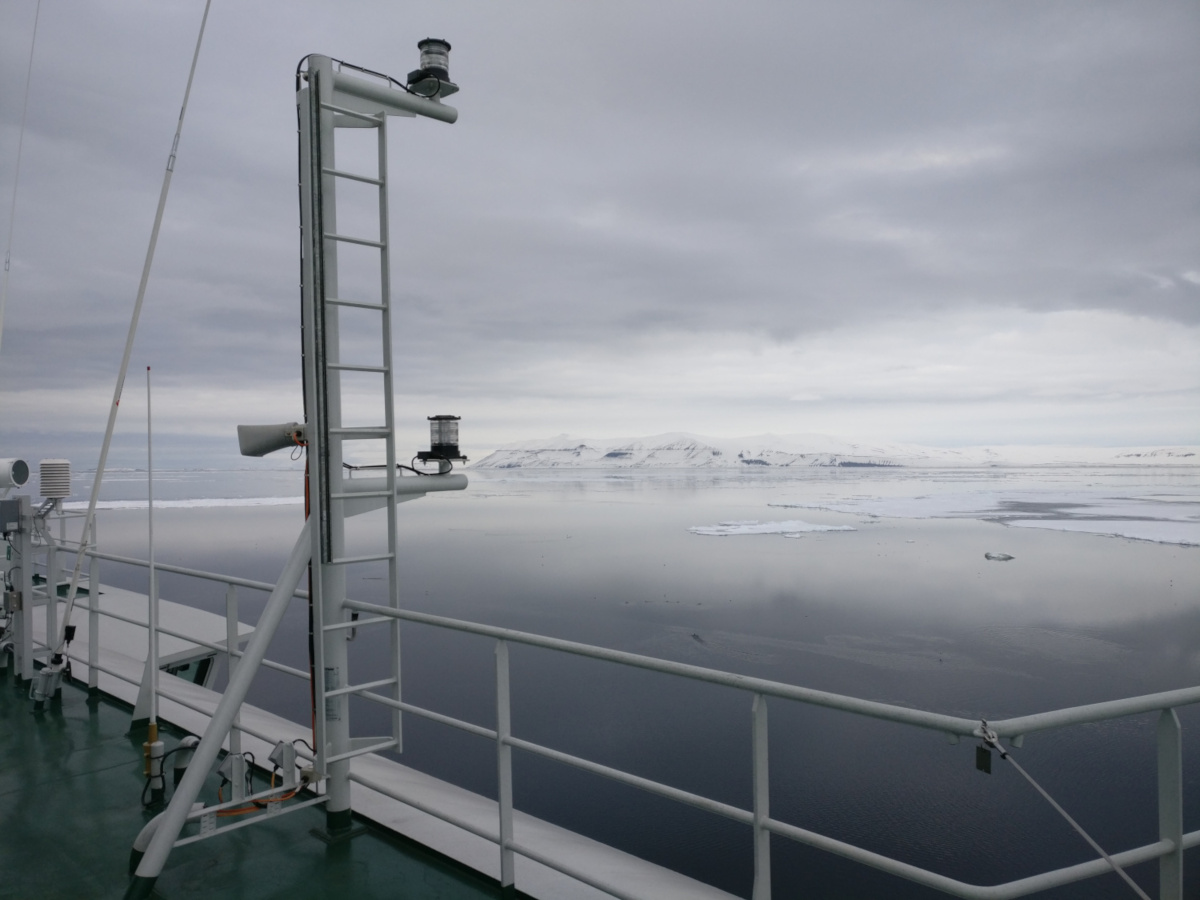
Sea-ice concentration is a low-resolution information layer for strategic planning purposes and to assist the interpretation of Sentinel-1 radar images. It is updated several times a day, automatically created and therefore to be used with care. Each pixel covers an area of 6.25 x 6.25 km2. Colours refer to the fractional area in percent (%) which is covered with ice. For a correct use of the sea-ice concentration layer the following guidelines should be considered:
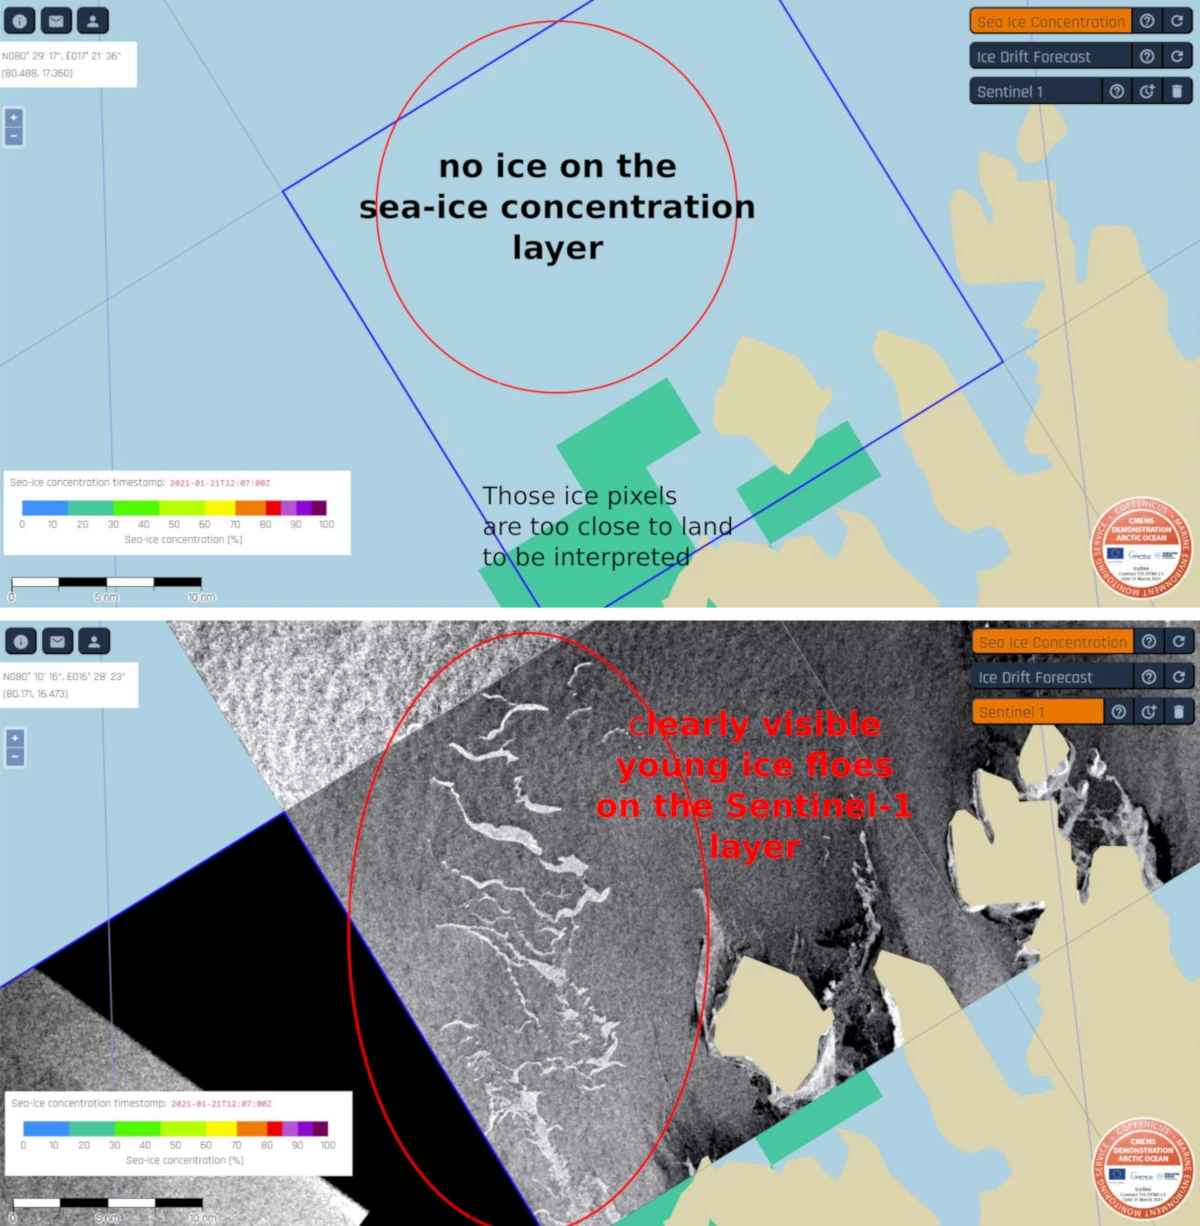
The 10% Rule
Sea-ice concentration below ~10% is not resolved by the sensor. I.e. a region showing no sea-ice concentration can still have enough ice floes remaining a significant navigational hazard.
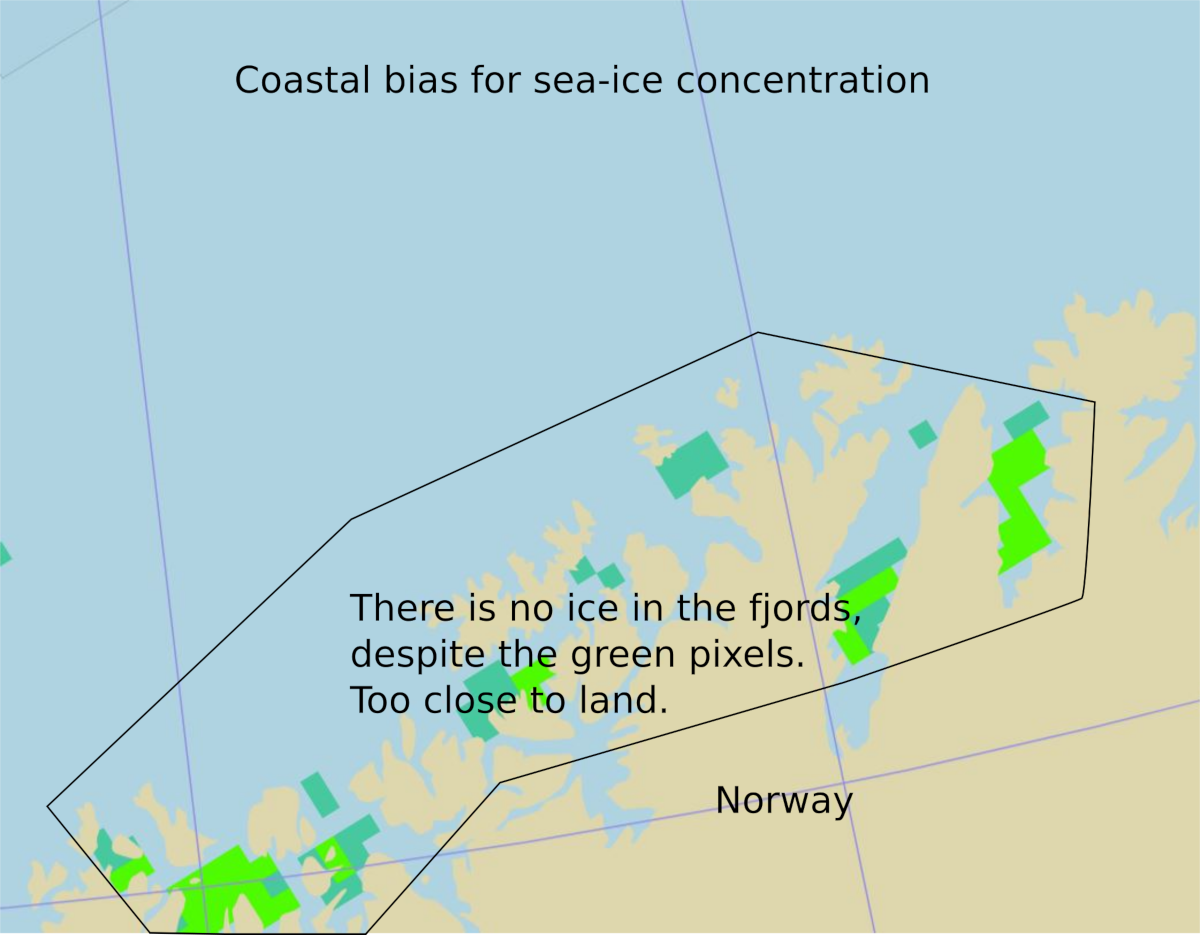
The Coastal Bias
Close to the coast the sea-ice concentration is overestimated due to the influence of land You can best see this by looking on the Norwegian coast, which never has ice. The sea-ice concentration you see close to the Norwegian coast is the expected error for all coasts.
No Ice Types
Sea-ice concentration does not indicate the type of ice. A 100% ice cover might be old multi-year ice, first-year ice or even a thin refrozen ice layer only. To clarify this, use additional radar images and/or ice charts, if available.
Check the Timestamp
When you compare sea-ice concentration with a satellite image, be aware of the different time stamps. The time-stamp of the current sea-ice concentration layer is shown in the lower left corner in red letters just above the colour code legend. Usually sea-ice concentration is the newest layer.
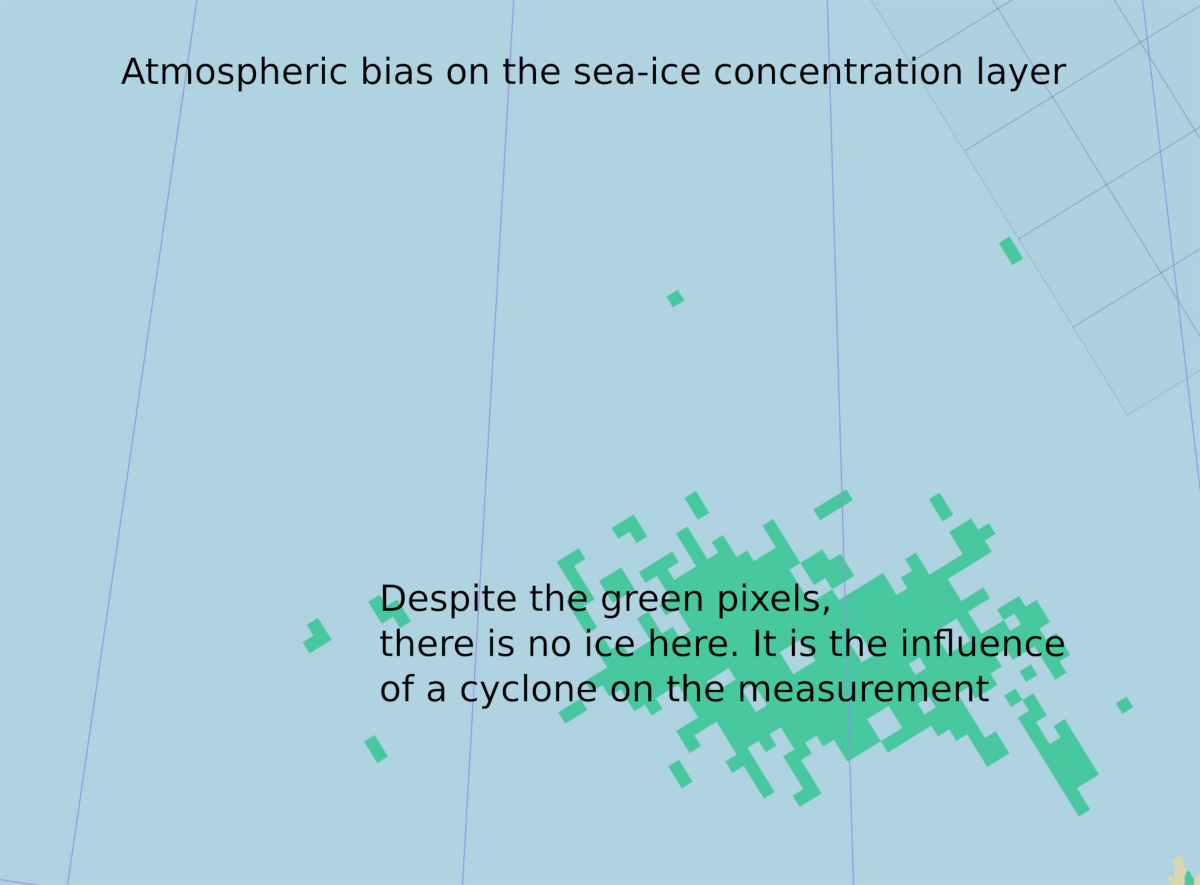
Atmospheric Bias
Large atmospheric cyclones influence the measurements as well. Sometimes you see large areas indicating a sea-ice concentration of about 20-30 % in the middle of the open ocean. This is very likely an error due to a cyclone.
Physical Background of the Data
The sea-ice concentration data layer is an automatically generated product on the basis of satellite based passive microwave measurements provided by the Japanese Space Exploration Agency's (JAXA) AMSR2 sensor of the GCOM-W mission. The GCOM-W satellite circulates the earth 14.5 times a day (=14.5 revolutions per day). Due to its polar orbit, it crosses the poles during every revolution. The AMSR-E sensor records the passive microwave radiation on a stripe of 1450 km width (so called swath width). The data are thankfully provided by JAXA after every revolution, which enables so-called swath updates several times a day. The physical parameters of the GCOM-W mission are available here.
The Sea-ice Concentration Algorithm
The conversion from passive microwave data to sea-ice concentration uses the ARTIST sea-ice algorithm from Spreen et al. (2008).