Ice Charts
The ice charts provide information on sea ice concentration, stage of development, and form. The displayed parameters strictly follow the definitions by the World Meteorological Organization (WMO).
Utilizing ice charts offers a significant advantage due to their adherence to the highly standardized WMO and International Maritime Organization (IMO) Polar Code protocols. These standards ensure that the information provided is deemed 'official,' sourced directly from state offices mandated to deliver such data and verified by expert human ice analysts.
With IcySea, leveraging the Egg Code and the POLARIS risk index system becomes remarkably simplified and streamlined. Interpreting ice conditions and assessing risk levels is made intuitive and efficient through user-friendly interfaces. By simply clicking on a polygon within the ice charts, users can access the Egg Code alongside a clear written explanation detailing the specific type of ice represented by each code.
Applying the POLARIS risk index system
You can now customize your version of IcySea and add the ice class of your vessel via the settings menu. Based on the selected ice class of your ship and the specific ice conditions, the ice chart layer provides the option to display your ship's Polar Operational Limit Assessment Risk Indexing System (POLARIS) Risk Index Outcome (RIO) value alongside the other data layers in the IcySea map. These values reflect your ship's operational capabilities when navigating in ice-infested waters and were developed in association with the IMO's Polar Code in 2014. The risk index contains various Risk Index Values that correspond to different stages of sea ice development for each individual ice class.
Data sources and links
We are working towards including official ice charts from all national ice services. The current version of IcySea contains ice charts from the following sources:
- U.S. National Ice Center (USNIC)A weekly updated ice chart that covers the entire Arctic and parts of the Antarctic.
- Danish Meteorological Institute
(DMI, data via DMI's public access point)DMI provides detailed ice charts for Greenland. These charts are usually updated on a regular basis, with some being updated daily, weekly, or according to specific needs, especially during the peak season.
- National Weather Service (NWS)The NWS of the United States of America provides daily updated ice charts from its Alaska Sea Ice Program (ASIP).
- Canadian Ice Service (CIS)
- Daily ice charts (Canada, daily (CIS)) represent the best estimate of ice conditions at the valid time of the chart, based on an integration of data from a variety of sources, such as satellite, and ship and aircraft-based visual observations. In the south, charts are available once ice forms. Charts for Northern Canadian Waters are prepared for areas with known marine activity.
- Regional ice charts (Canada, weekly (CIS)) show the analysis of ice conditions for a given region valid on Mondays and updated on Wednesdays. They are based on an analysis and integration of data from: satellite imagery, weather and oceanographic information, visual observations from ship and aircraft. Satellite imagery is collected over a few days in order to have complete coverage of the area. The regional charts cover the entire Canadian Arctic and east coast of Canada.
- Argentinian Naval Hydrographic Service (SHN)SHN provides weekly updated charts for sea ice concentration and stage of development for Antarctic NAVAREA VI.
- Norwegian Meteorological Institute (MetNo)MetNo's sea ice concentration charts for the Atlantic sector of the Arctic are produced on week days. Antarctic sea ice concentration charts are produced on a weekly basis for Antarctic NAVAREA VI.
Interpretation guidelines
Sea ice concentration charts
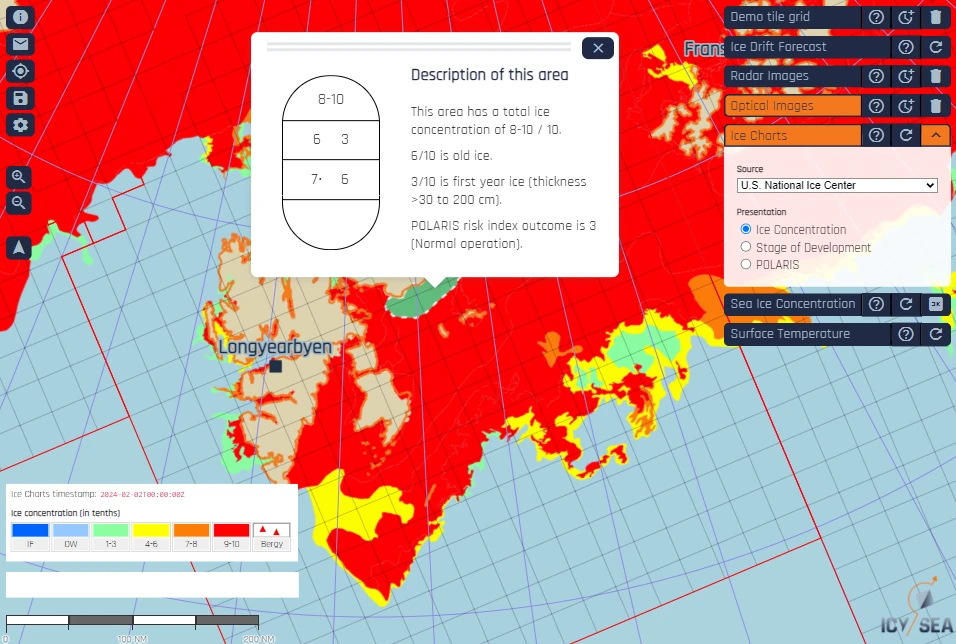
The ice concentration charts provide polygons of uniform sea ice concentration. Sea ice concentration is given in tenths. A polygon showing e.g. 8-10 tenths indicates an area that is 80 to 100% covered by ice. The color coding does not provide information about the types of ice in the polygon area. This additional information is provided by the official Egg Code and more detailed explanations, which can be accessed by a 'Left Click' on the polygon of interest in IcySea (Fig. 1).
Stage of Development
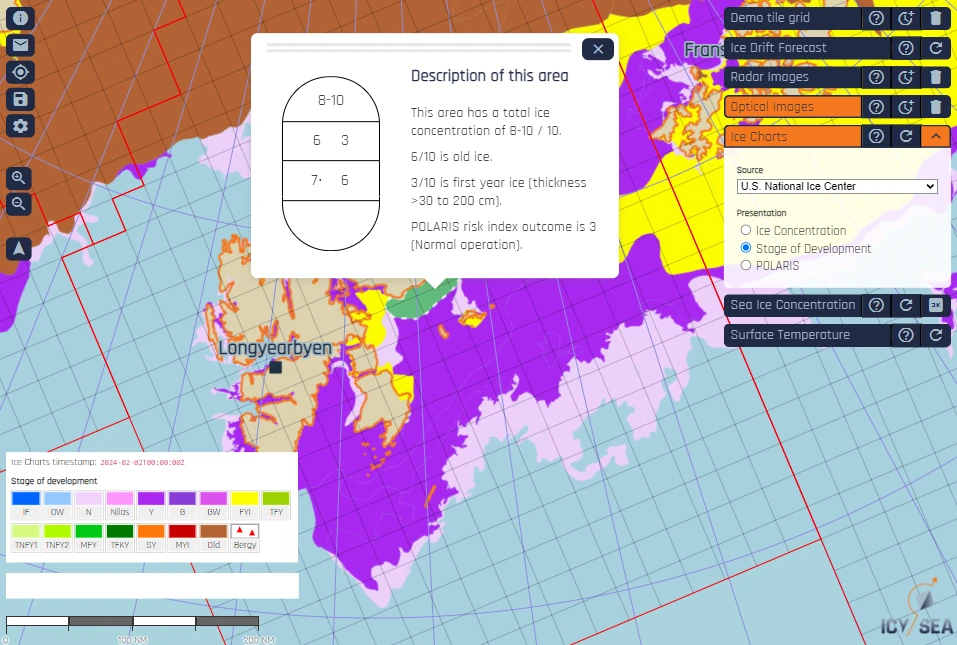
The ice charts in IcySea also provide the option to switch from the Sea Ice Concentration to the Stage of Development (age) layer (Fig. 2). The Stage of Development charts are designed to indicate the age of the observed ice within the various polygons. The same polygons are used but with the color coding of the Stage of Development (age). Based on the partial concentrations of the observed ice, the Stage of Development layer shows the color code of the most extensive (highest concentration) partial ice type within the respective polygon. The 'Left Click' on the polygons accesses the Egg Code.
POLARIS Risk Index
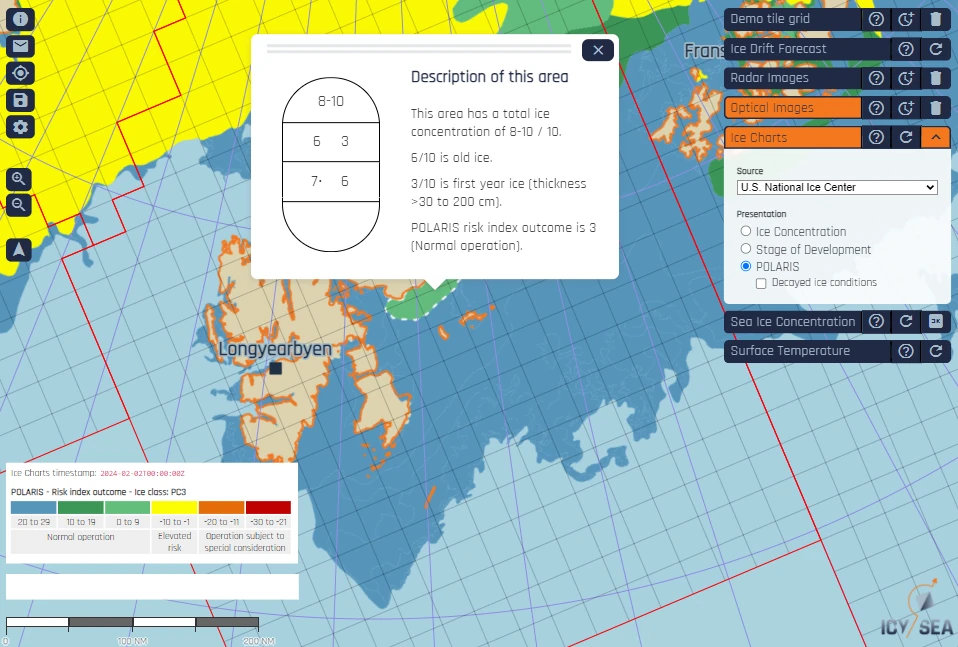
The IMO Polar Operational Limit Assessment Risk Indexing System (POLARIS) Risk Index Outcome (RIO) is a value for the evaluation of risk of a ship operating in or planning to operate in ice-infested waters. The RIO evaluation is based on the prevailing ice conditions in the area of operation and the ice class of the ship operating in this area. POLARIS RIO values can fall into three categories, where ship characteristics and ice conditions determine the ship-specific range of these categories: 1) Normal operation, 2) Elevated risk and 3) Operation subject to special consideration (Fig. 3). Especially during the melt season ice can decay rapidly, which affects the RIO value for the individual ship in a melting and degraded ice environment. If navigators detect decaying sea ice they can select the 'Decayed ice conditions' feature within the POLARIS ice chart menu in IcySea. It is imperative to put great consideration into this assessment because selecting this option will recalculate the RIO for the new conditions and the ship's ice class. Regions that might have been indicated to be 'elevated risk' regions for your ship could be considered regions of 'normal operation' for your ship, so navigators need to be sure about the state of the ice in order to avoid navigating through risky areas.
Egg Code
The Egg Code provides basic data concerning concentration, stage of development (age) and the form of the observed sea ice (floe size). With its oval form the Egg Code is able to indicate up to three ice types showing the partial concentration, stage of development and form of the thickest, second thickest and third thickest ice from left to right in three vertical levels (Fig. 4).
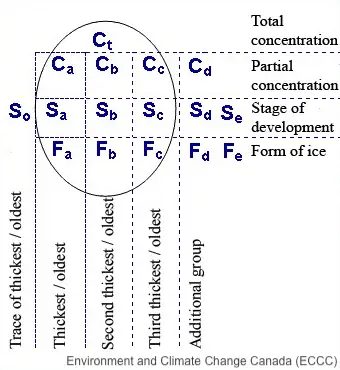
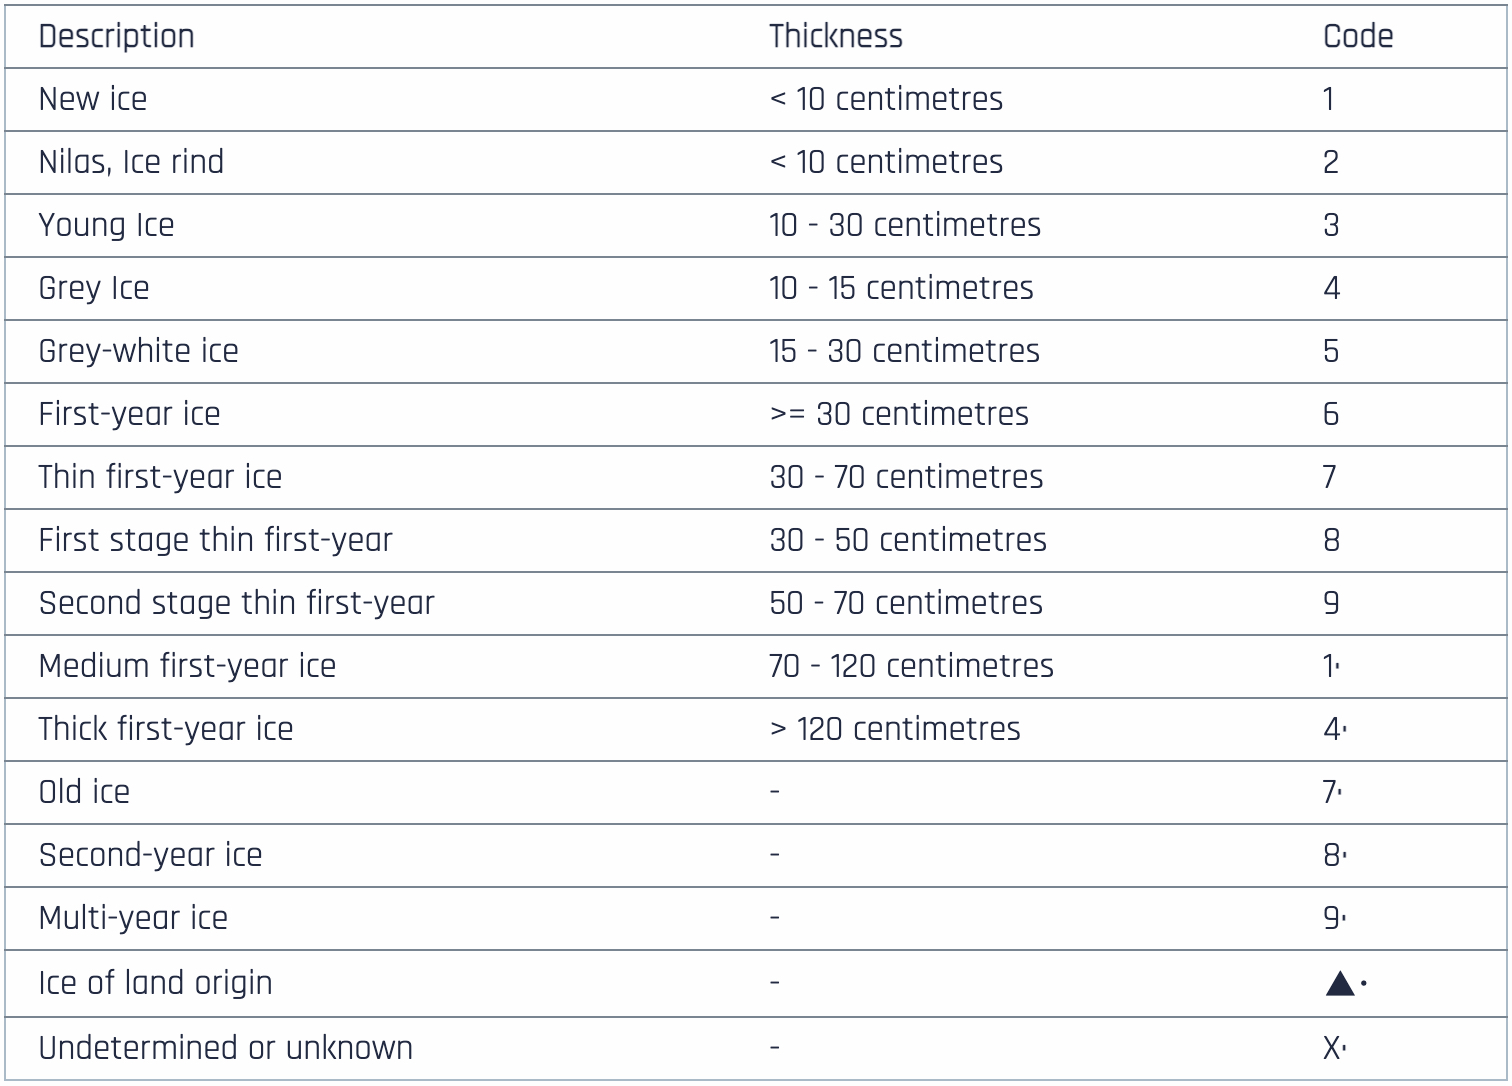
While the top value of the Egg Code describes the total concentration of all the ice in the respective polygon, the second level (C) provides partial concentrations of the thickest, second, and third thickest ice in tenths (from left to right). The third level (S) quantifies the stage of development of the thickest, second thickest, ... ice using a designated code (see Table 1).
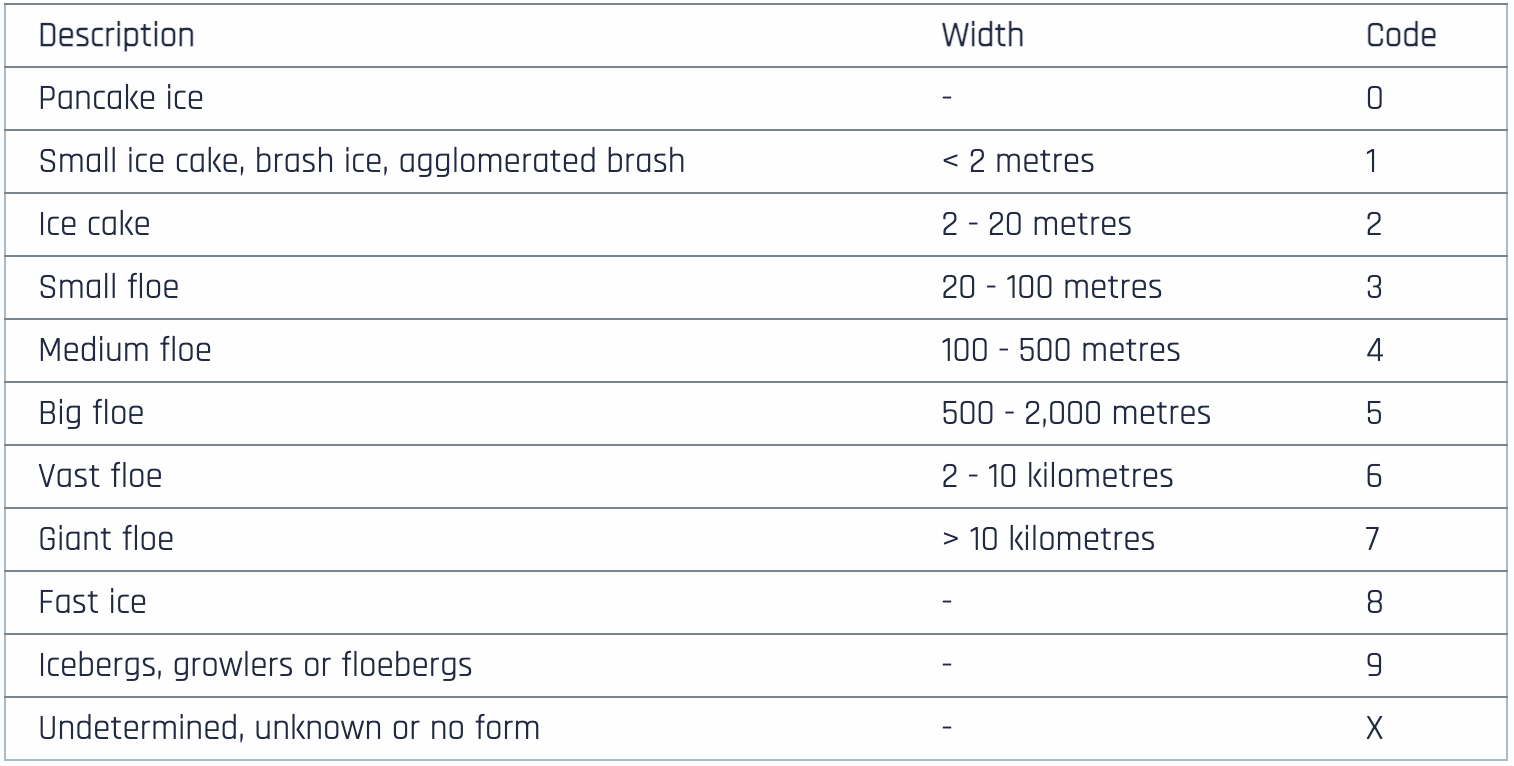
Lastly, the fourth level (F) provides information on the floe size (form) of the observed ice. F is given as a code as well with the respective floe sizes for each code given in Table 2.