Frequently asked questions
Below is a selection of questions that users frequently ask along with their answers. Naturally, if you don't find what you're looking for here, or if any recommendations in the answers don't work for you, please don't hesitate to contact our support staff via support@driftnoise.com.
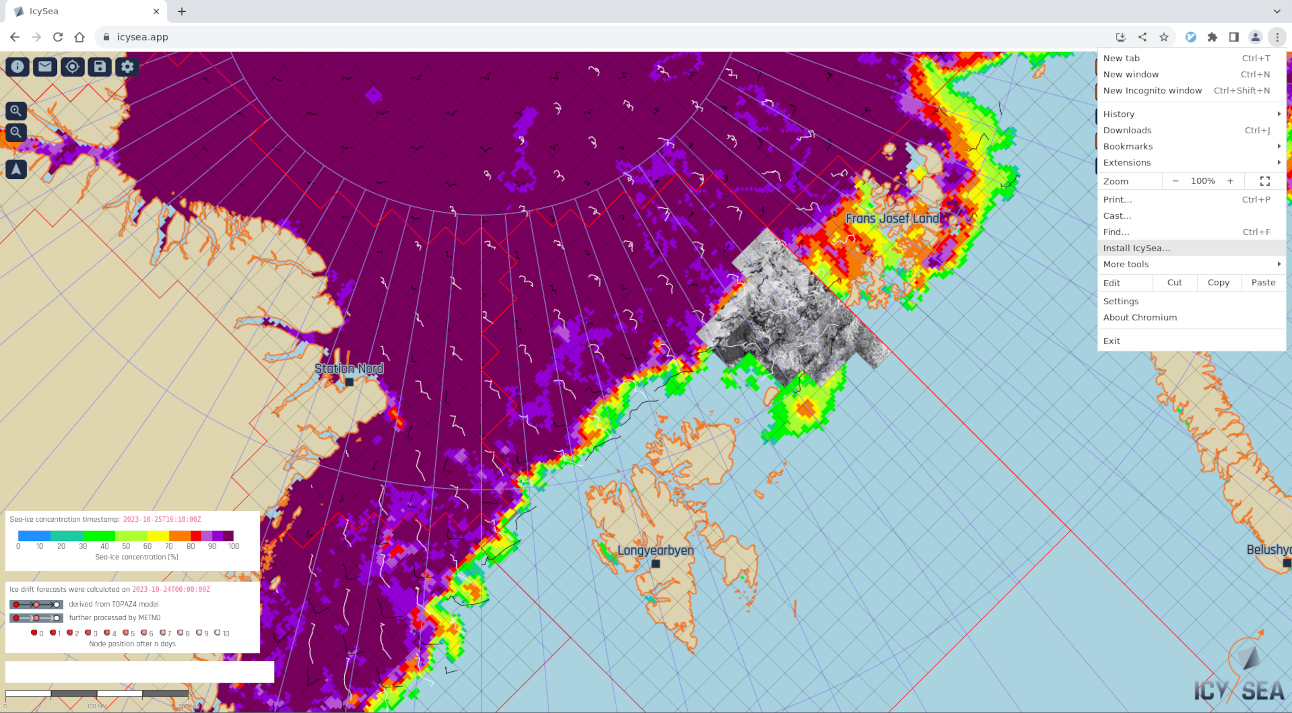
Within the IcySea App click on the "i" button (in the upper left corner), scroll down to the bottom of the window and select "Check for update". If there is a new update available close the "i" window and click on the "Update" button on the left side of your screen. Be aware that the IcySea download will use up about 80 Megabyte, so make sure you have a stable internet connection capable of facilitating such a data volume.

Within the IcySea App click on "Settings" (The wheel icon in the upper left corner) and then click on "Update subscriptions". Your new subscription period should be displayed now.
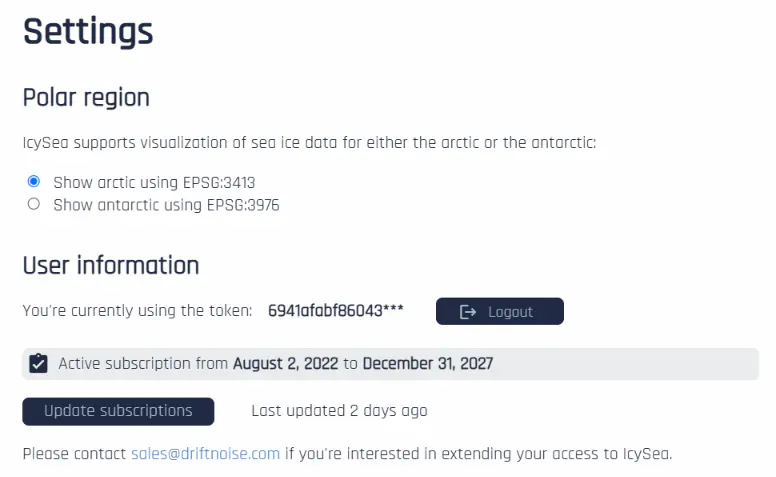
- All data products are gathered from external sources. As soon as the respective data set becomes publicly available it is processed and displayed in IcySea, which allows you to utilize near real-time information for your operations.
- Sea-ice concentration
- Activate the layer and a legend at the bottom left gives additional information including a timestamp. The sea-ice concentration layer is updated up to eight times a day, so you should refresh the layer regularly.
- Surface temperature
- Click on the layer name in the layer control panel at the top right hand corner of the app to activate the layer. You will now see surface temperature timestamp and colour map information in the bottom left hand corner of the page. Surface temperature information is updated daily at approximately 14:00 UTC.
- Ice drift forecast
- Activate the layer and a legend at the bottom left gives additional information including when the forecast was calculated. The ice drift forecasts are updated once per day.
- Ice charts
- Activate the ice charts layer and the corresponding legend in the bottom left corner will provide the date and timestamp. When clicking on the ice chart polygons of the DMI ice charts the egg code box will also display the age information. Data updates depend on where the data is coming from. DMI updates usually come in between every one to three days, while US ice charts are produced on a weekly basis.
- Radar and optical images
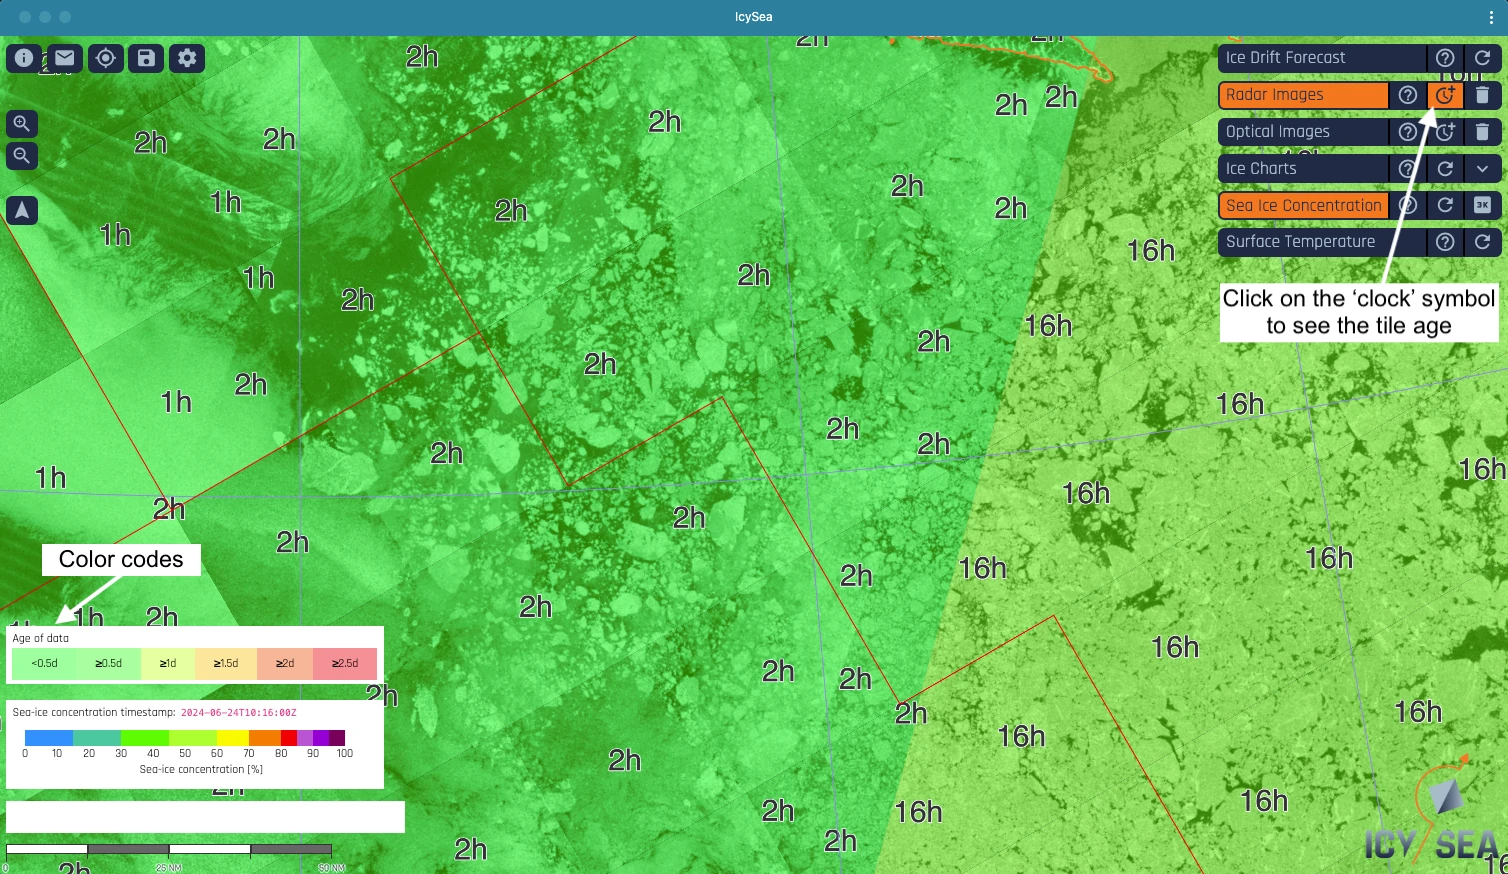
- On the layer button of radar/optical images click on the "clock" symbol. All images will be colour-coded according to age, legend appears at the bottom left. If you zoom in the tiles of interest, their exact age of data tiles will show. See the example below:
A route may not be visible if its hidden. To show it again, open the User Map Data list using the button on the left side of the map, then click the eye icon next to the route.
Note that User Map Data features are only stored locally where they were drawn or imported. To use them elsewhere, export them first and import them on the other device.